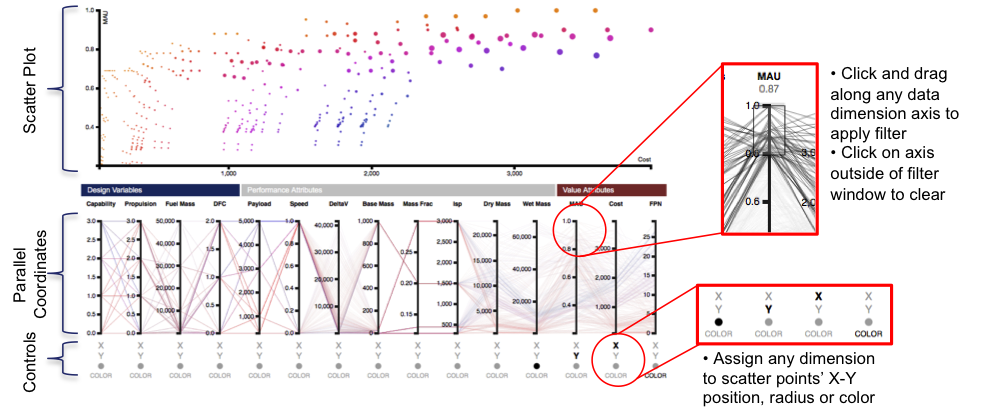
Single epoch analysis is comparable to what is often traditionally referred to in practice as tradespace exploration. Within a given scenario (or epoch) a scatter plot of cost versus the performance of a system can be constructed that is fixed for short-run periods of stable context and needs (i.e. epoch). More generally, all the relevant performance attributes can be aggregated into a single measure of value to the stakeholder using multi-attribute utility (MAU) theory to provide a single measure of benefit for each system. Cost can also be generalized to include all types of expense (e.g. time, scarce resources, colors of money) using multi-attribute expense (MAE) functions. Typically, a decision-maker wants to identify the frontier of Pareto optimal designs or designs that are “close enough” to the Pareto front.
In this example, multiple coordinated views and animated transitions are used as approaches for facilitating deeper understanding of the data. Multiple coordinated views can be useful in exploratory visualization to more effectively expose relationships in the underlying data. Coordinated views are separate, independent views of a given set of data that serve as complementary representations, and may aid in identifying patterns as well as errors in the data. The individual views of the data are not intended for use in isolation, but rather to be combined to generate insights. The primary purpose of coordinated visualizations is to allow improved understanding through user interaction with different simultaneous representations of the data [2]. While choosing which combinations of views to use in order to generate insights can be complicated, several guidelines, including compactness and diversity of the visualizations, have been discussed in prior literature [3].
[1] Smaling, R., “Fuzzy Pareto Frontiers in Multidisciplinary System Architecture Analysis”, 10th AIAA/ISSMO Multidisciplinary Analysis and Optimization Conference, Albany, NY, September 2004.
[2] Roberts J. State of the art: coordinated & multiple views in exploratory visualization. 5th Int’l Conf on Coordinated and Multiple Views in Exploratory Vis. Washington, DC, 2007.
[3] Scherr M. Multiple and coordinated views in information visualization. Media Informatics Advanced Seminar on Info Vis. 2008/2009.